
The hidden forecasting power of your favorite dashboard builder
Reporting tools are like rearview mirrors. That’s useful, but it won’t help you catch seasonal drops or spikes before they happen. Here’s a small Looker Studio trick that turns last year’s data into a smart signal for what's ahead.
Here’s the trick:
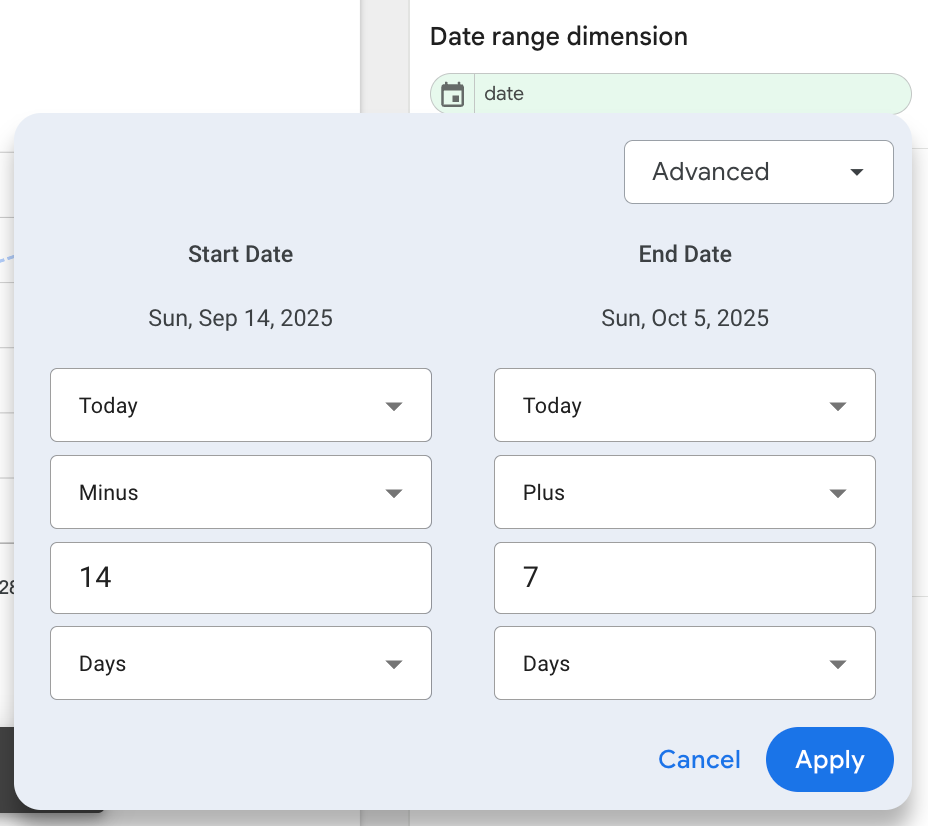
- Select a custom date range (e.g. Last 14 days).
- Add a comparison with the same period last year.
- Extend the range in Advanced mode (e.g. today + 7 days).
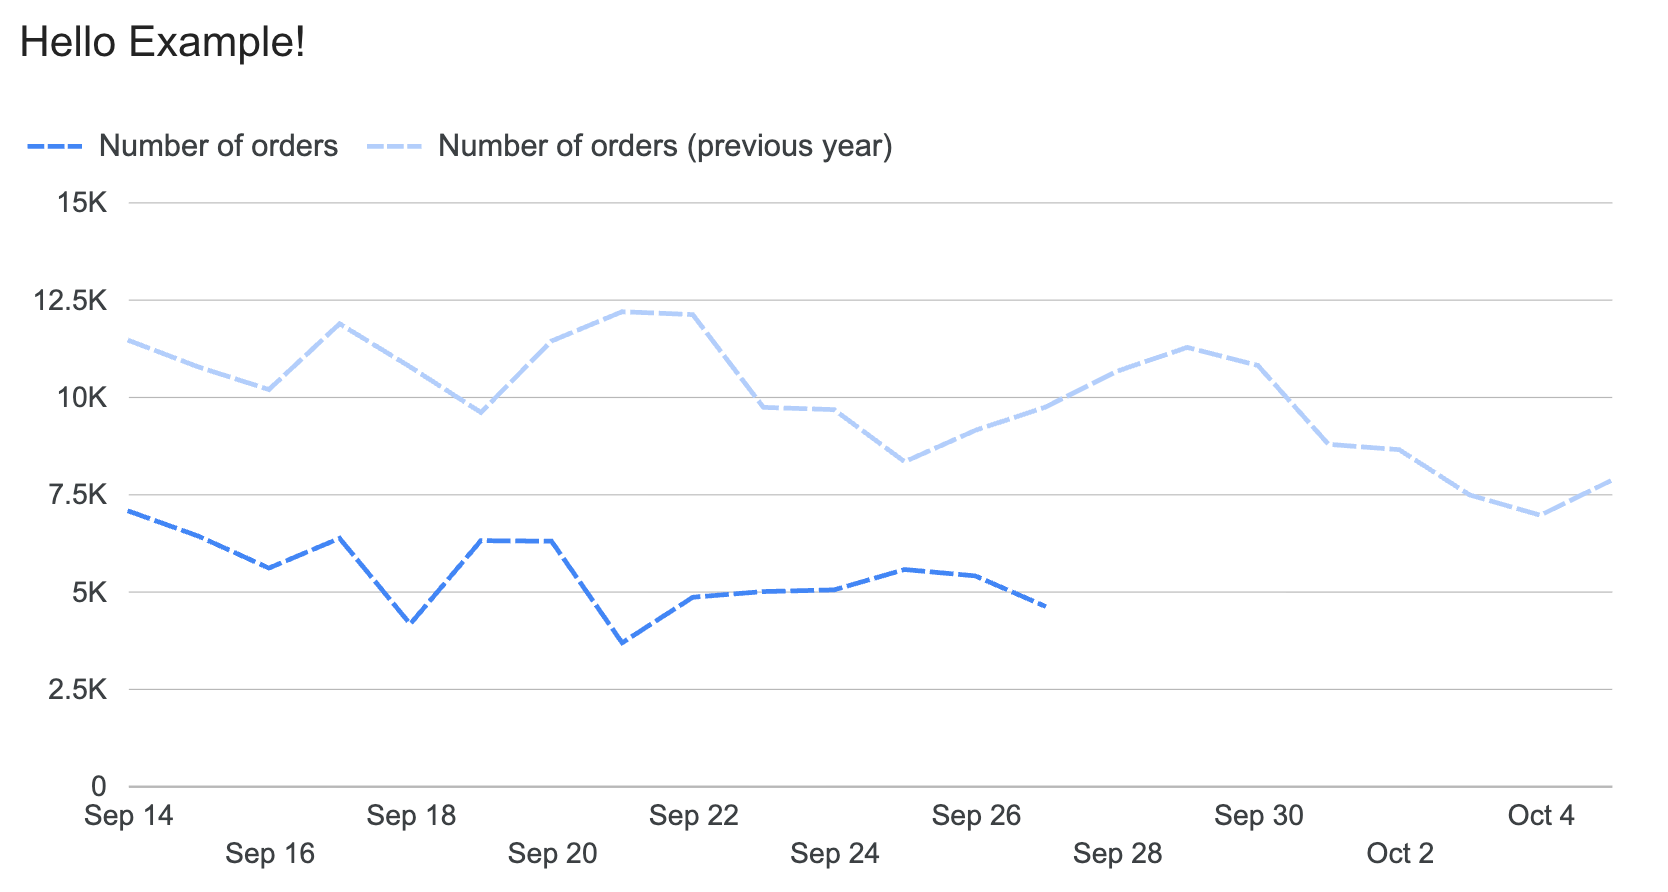
Now you don’t just see the past but also what’s likely coming in the next days / weeks / months, based on last year’s seasonality.
Instead of reacting to drops or spikes once they happen, you get an early signal. That means you can prepare campaigns, adjust budgets, or secure inventory before the curve hits.
A few questions this helps answer:
- Did we already capture the whole addressable market at this time last year?
- Is the market share left to competitors worth chasing now?
- Should we start increasing or decreasing our budget
Tweak it with different KPIs. I personally use four graphs on the same campaign (each with a different KPI) so I can cross-check signals from last year with the last 14 days of data.
Et voilà, you got a dashboard that doesn’t just report, but help you see what’s coming next.


Comments ()