Apple Search Ads: Looker Studio template
Actionable Looker Studio template to analyse and optimise your Search Ads campaigns.

Since I began user acquisition for mobile apps in 2020, I didn't came accross a lot of paid acquisition templates; especially for Apple Search Ads. So here's one you can use for free!
Apple Search Ads still lacks lots of basic features to properly analyze data directly from the platform itself. The best is yet to export the data either to a data warehouse or directly to Google Sheets, then create a dashboard.
There are many ways to do so and the way the dashboard is built will mainly vary depending on your account structure: agency side, international campaigns, etc.
Exporting data: impression share report
Either you're using the manual export from Apple Search Ads or the API, here are the fields we need to properly run our dashboard:
- Date
- Search term
- Impression share
- Impressions
- Taps
- Tap Through Rate (TTR)
- Conversion Rate (CR)
- Average Cost Per Tap (CPT)
- Average Cost Per Acquisition (CPA)
- Spend
- Installs
- New downloads
- Redownloads
Apple Search Ads report
Main dashboard
Filters
You can filter by date and search term. Most of the charts are using date by day so you will easily be able to zoom in a specific date or date range.
In case you're using a specific setup and would like to filter by account, campaign, ad group, etc. you can easily add new controls and dropdown lists.
Your feedback is more than welcome as well as your feature requests if you have some so feel free to drop me a line directly on Twitter.

Charts
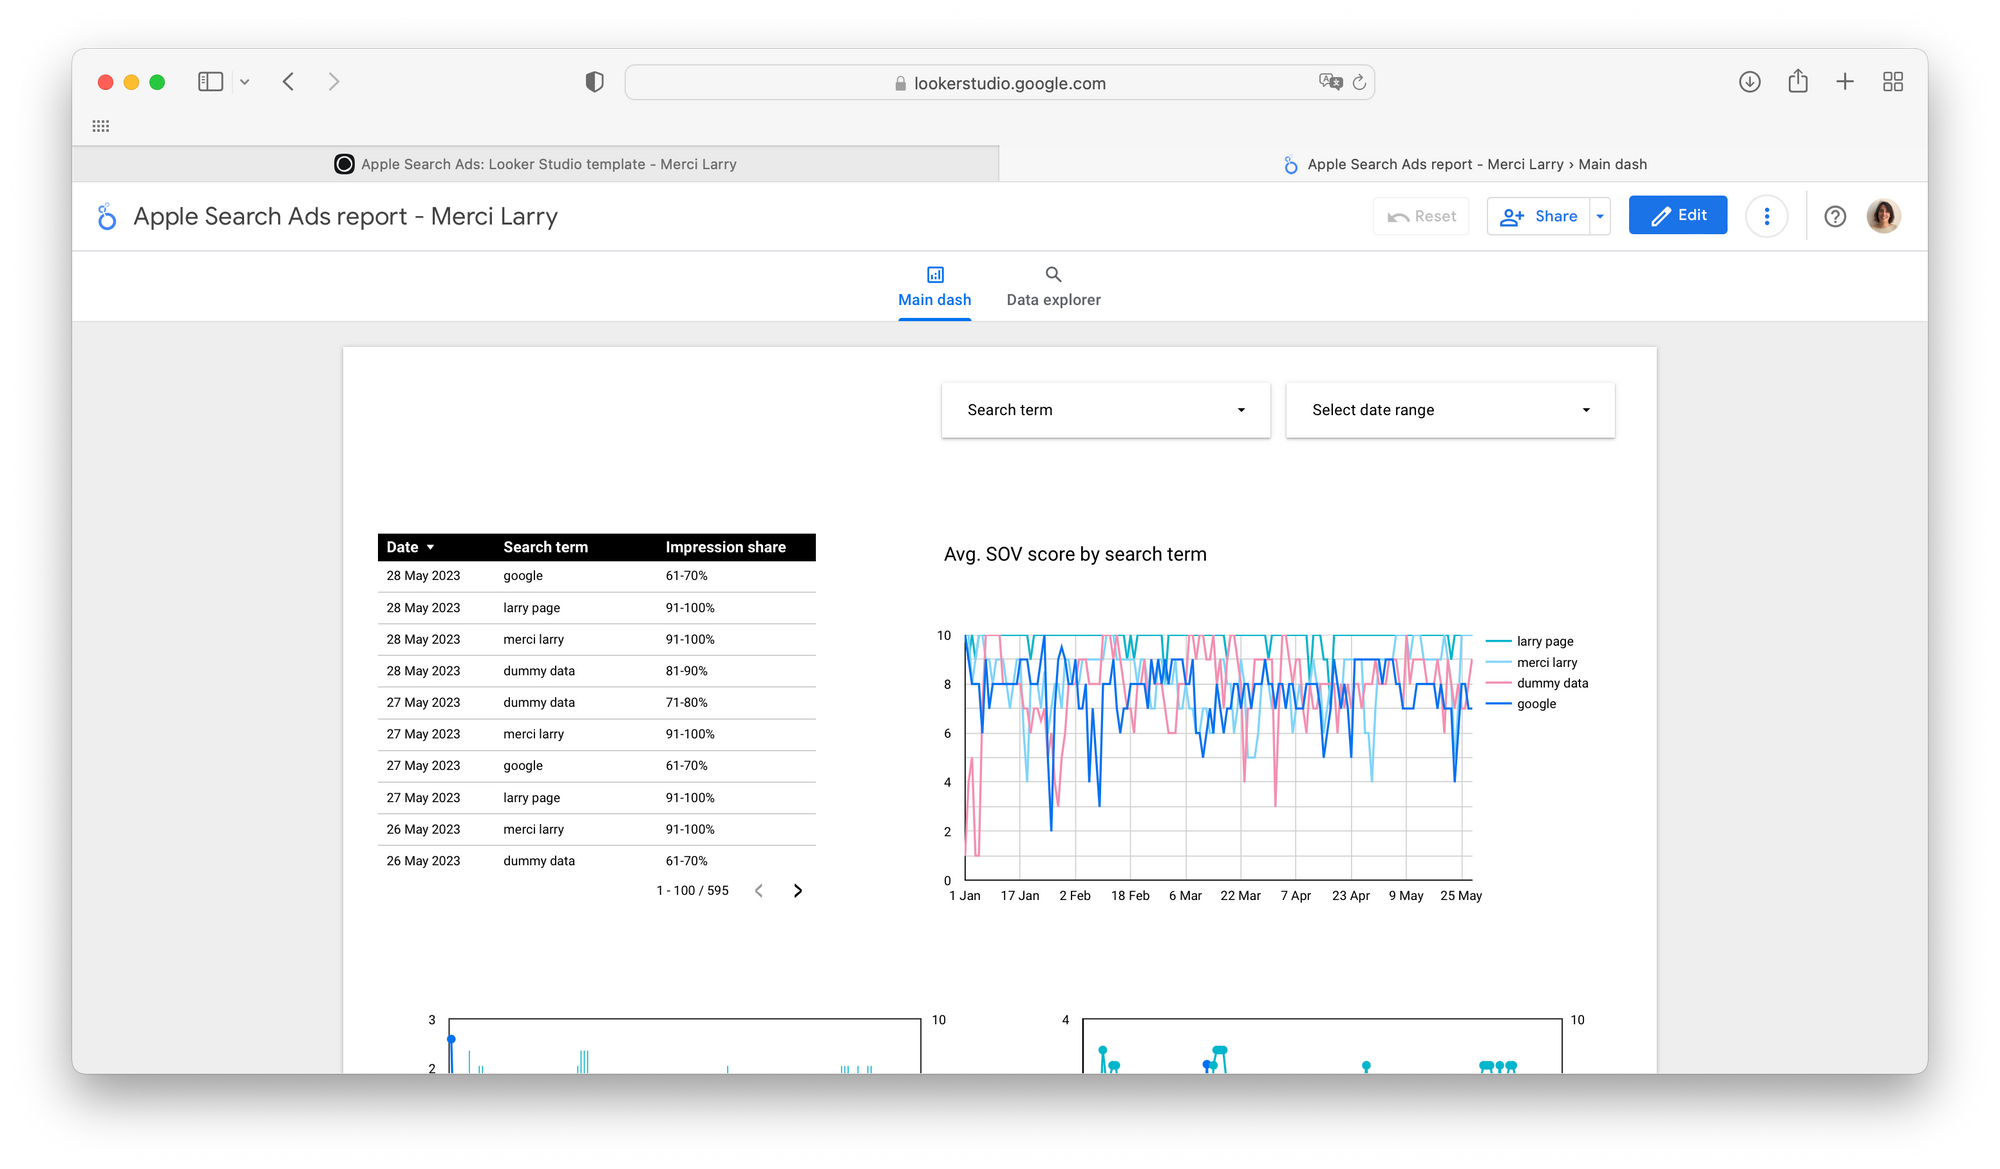
First, you get a glance at your impression share by search term and by day. You can also visualize your impression share evolution by day using the chart: note that I transformed the impression share as a Share Of Voice (SOV) score to easily use it on charts. Here's the formula used:
=if(C2="0-10%",1,if(C2="11-20%",2,if(C2="21-30%",3,if(C2="31-40%",4,if(C2="41-50%",5,if(C2="51-60%",6,if(C2="61-70%",7,if(C2="71-80%",8,if(C2="81-90%",9,if(C2="91-100%",10,""))))))))))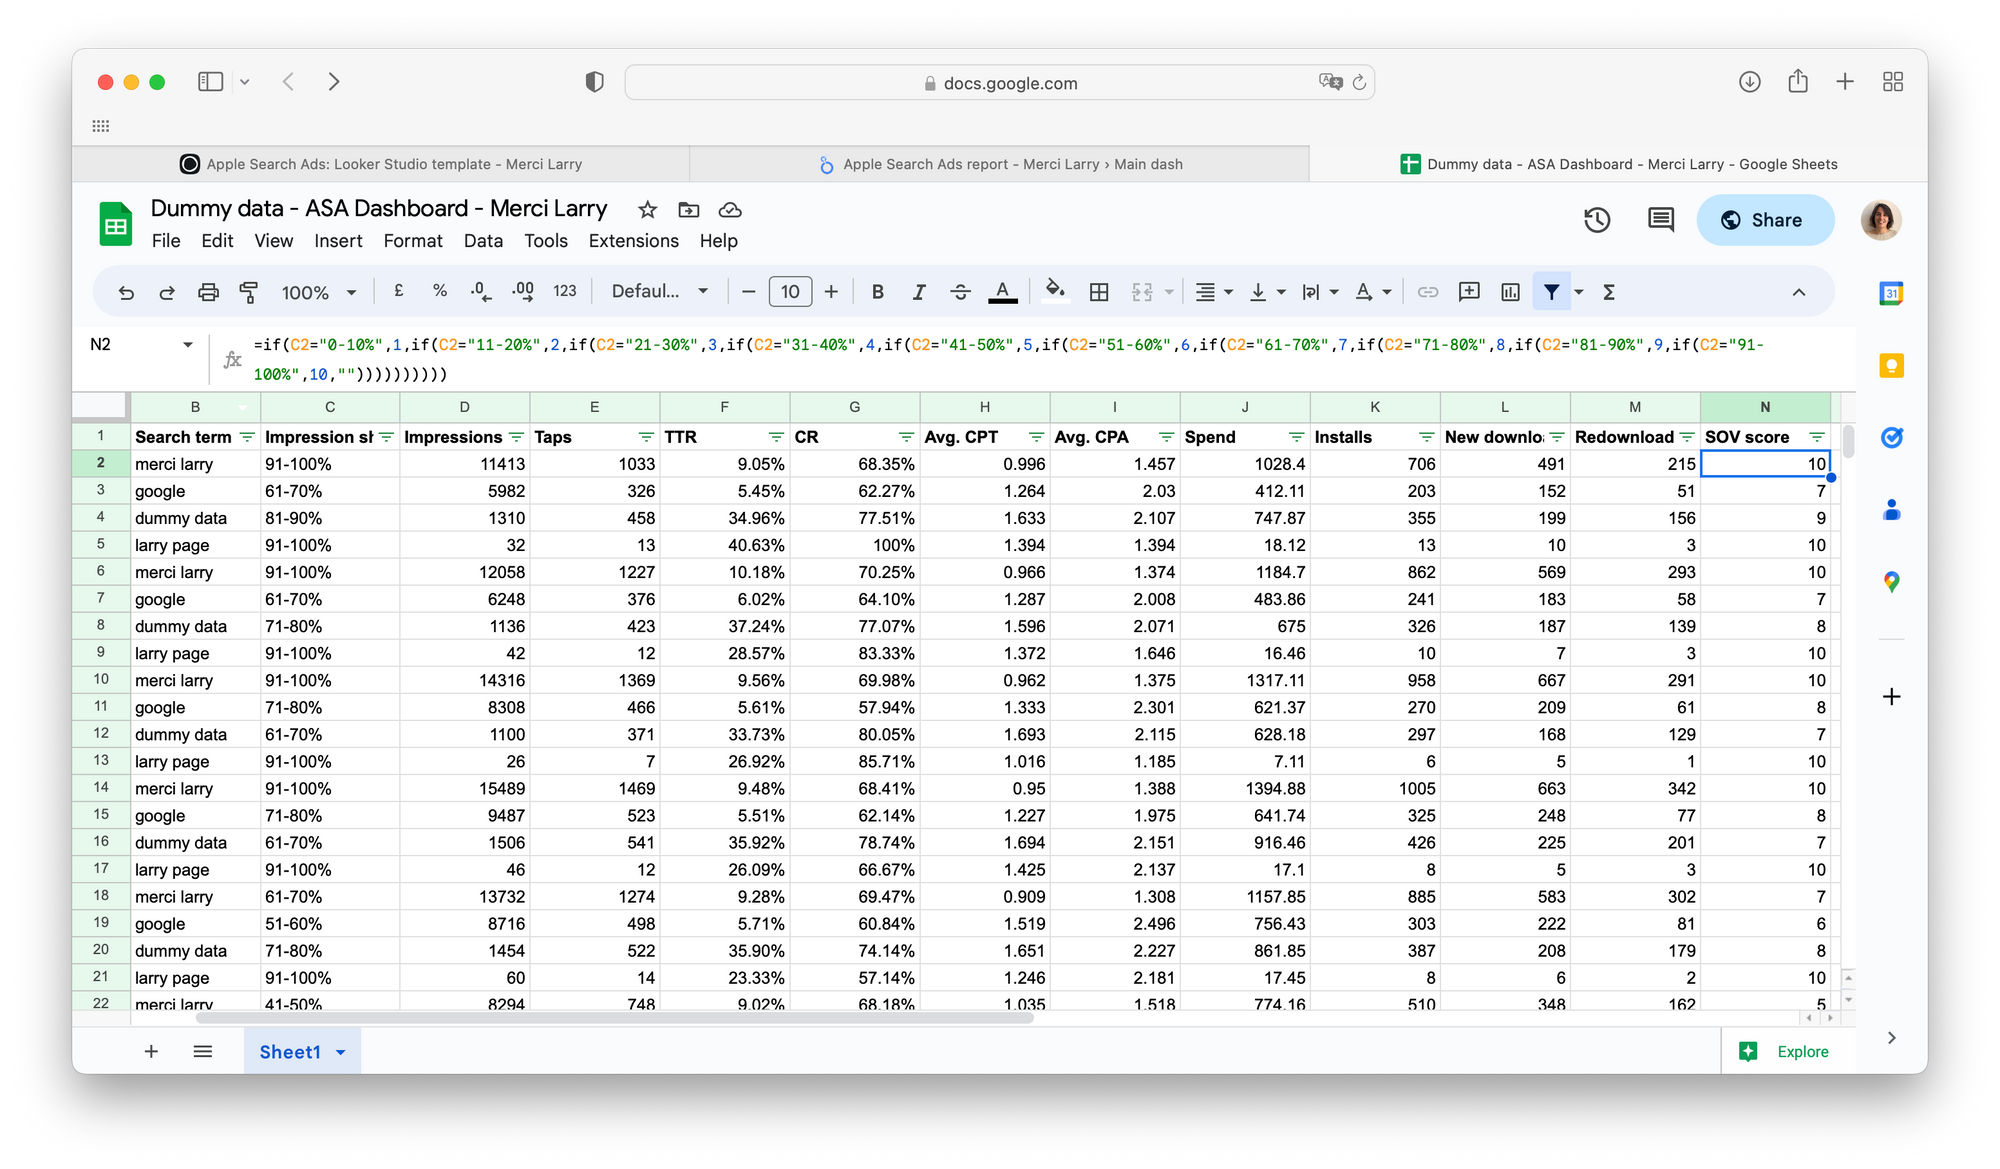
Then comes a focus on the average CPA. The first graph calculates the running delta day by day while the second one shows the evolution on a daily basis. The scatter plot will help you answer the question: does my bid have an impact on the share of voice?
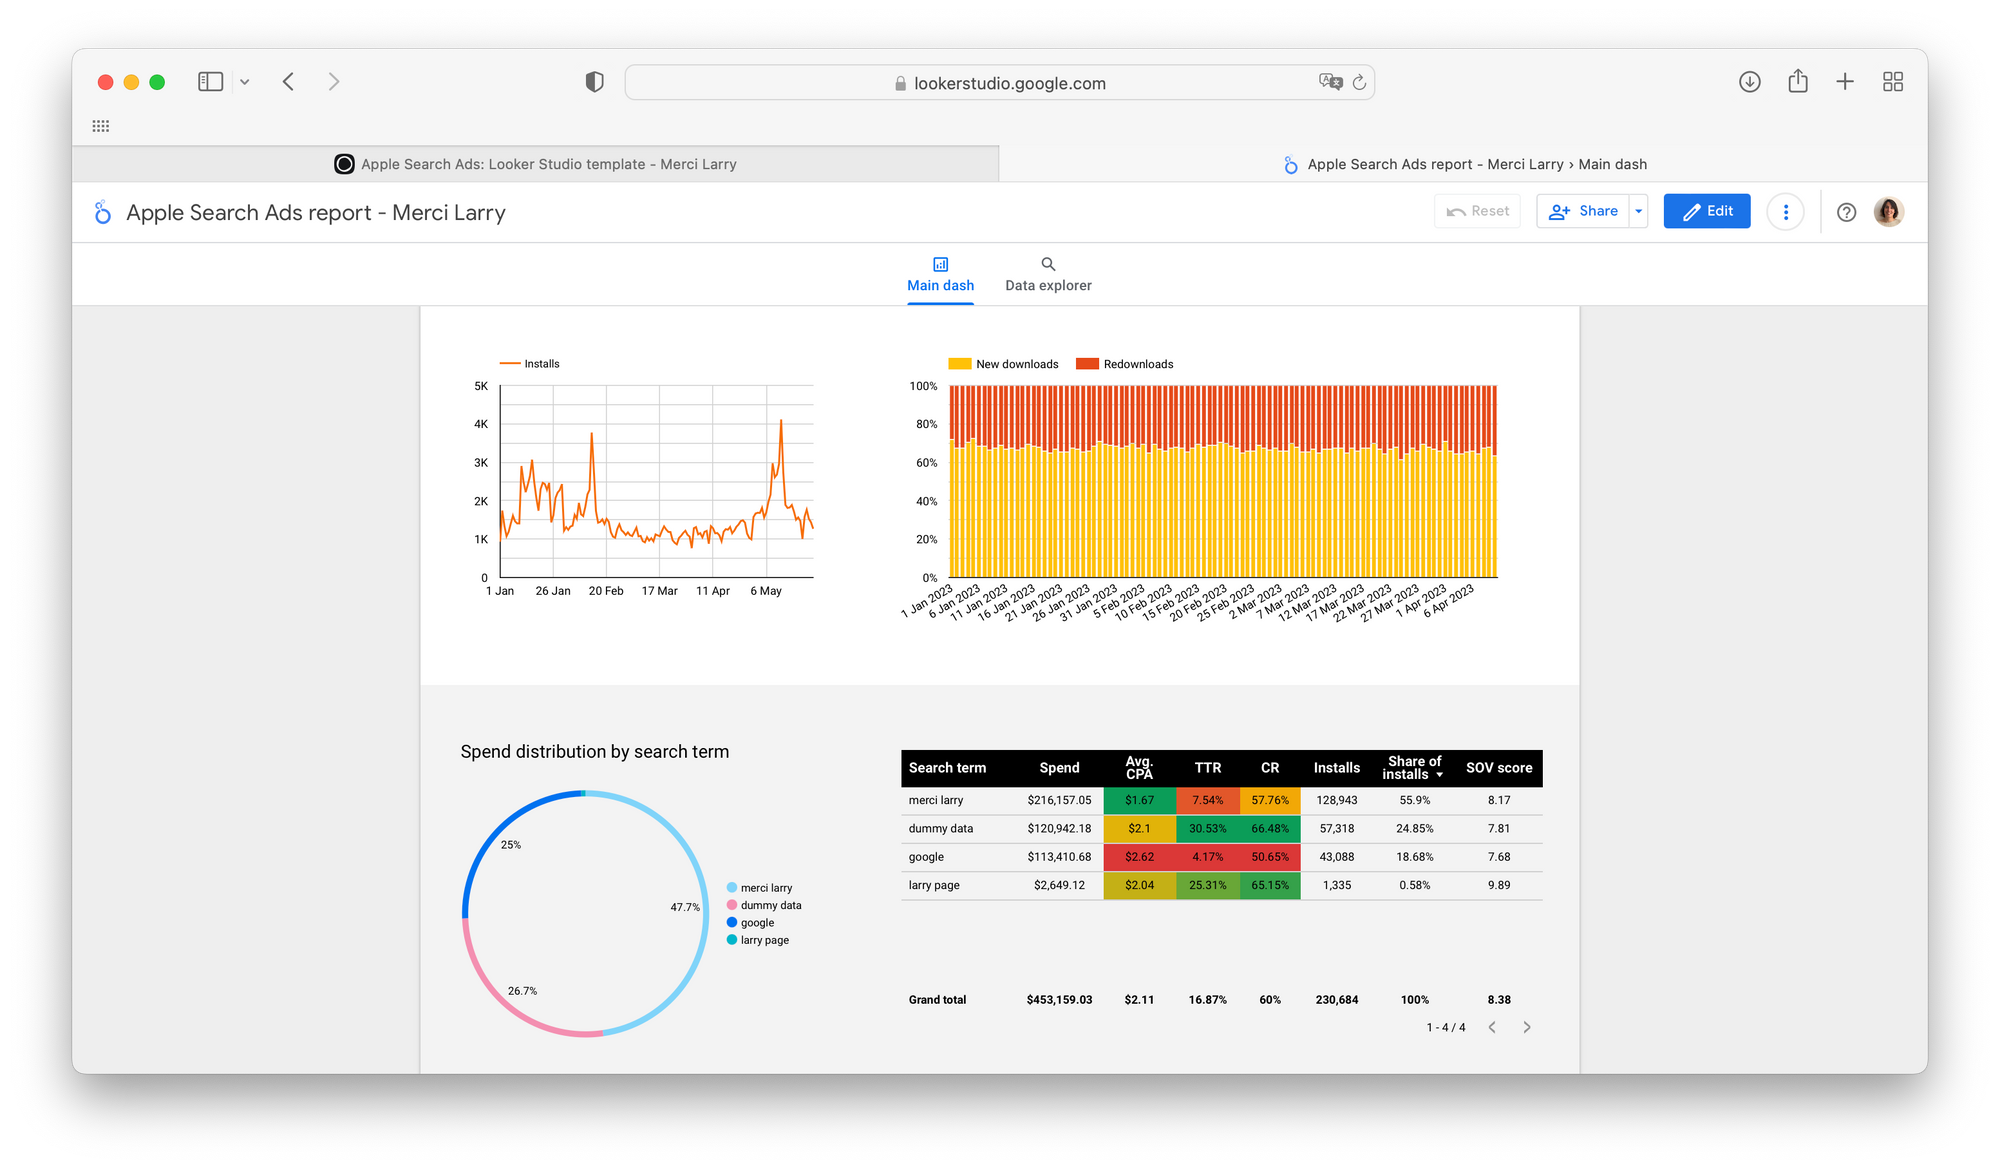
Since we can't attribute the cost by type of installs, you will only find the split by installs and then the spend distribution by keyword. The table will help you compare the performances of a dedicated search term over the others and your global average as well.
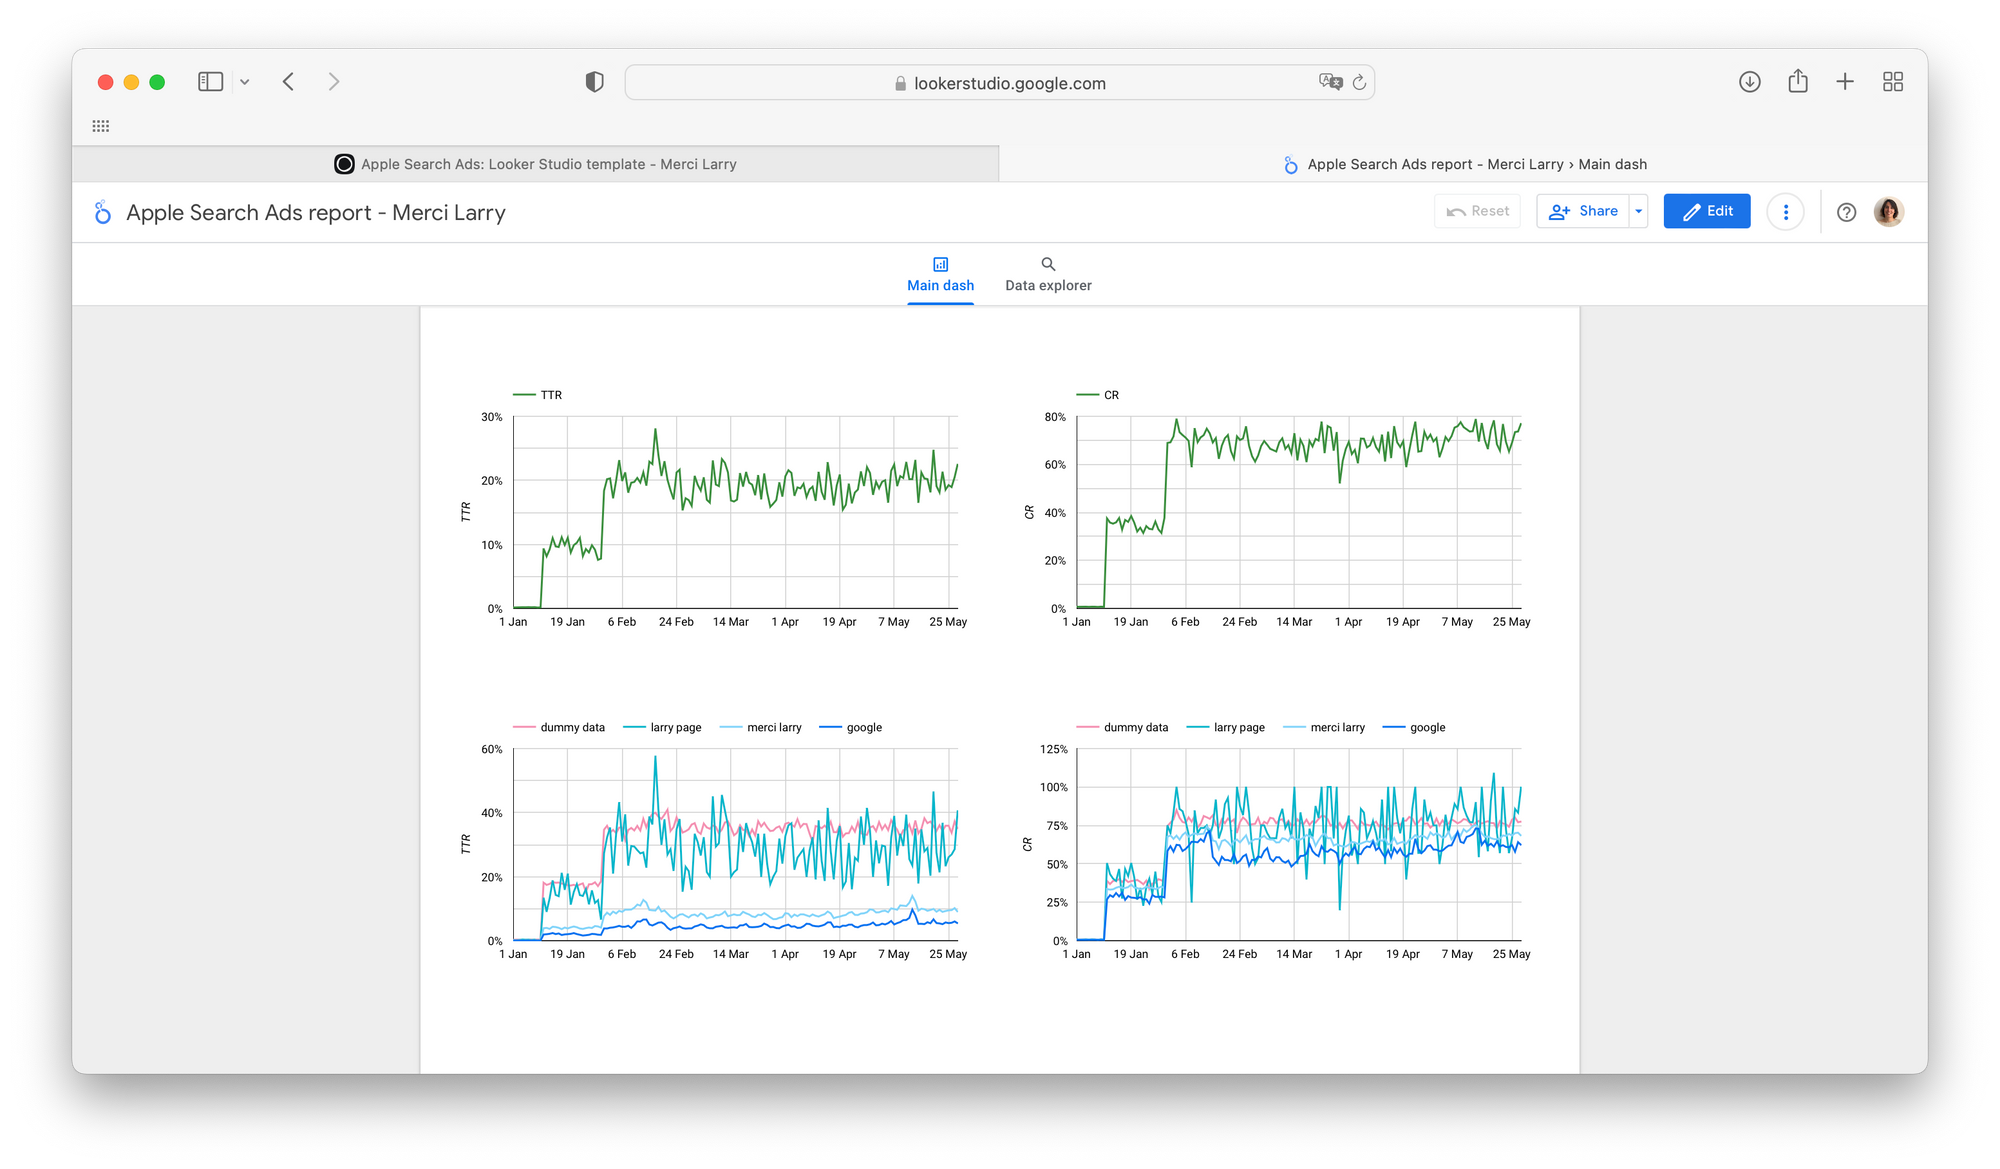
From a global standpoint and then a more granular one, you can easily spot anomalies on your TTR and CR.
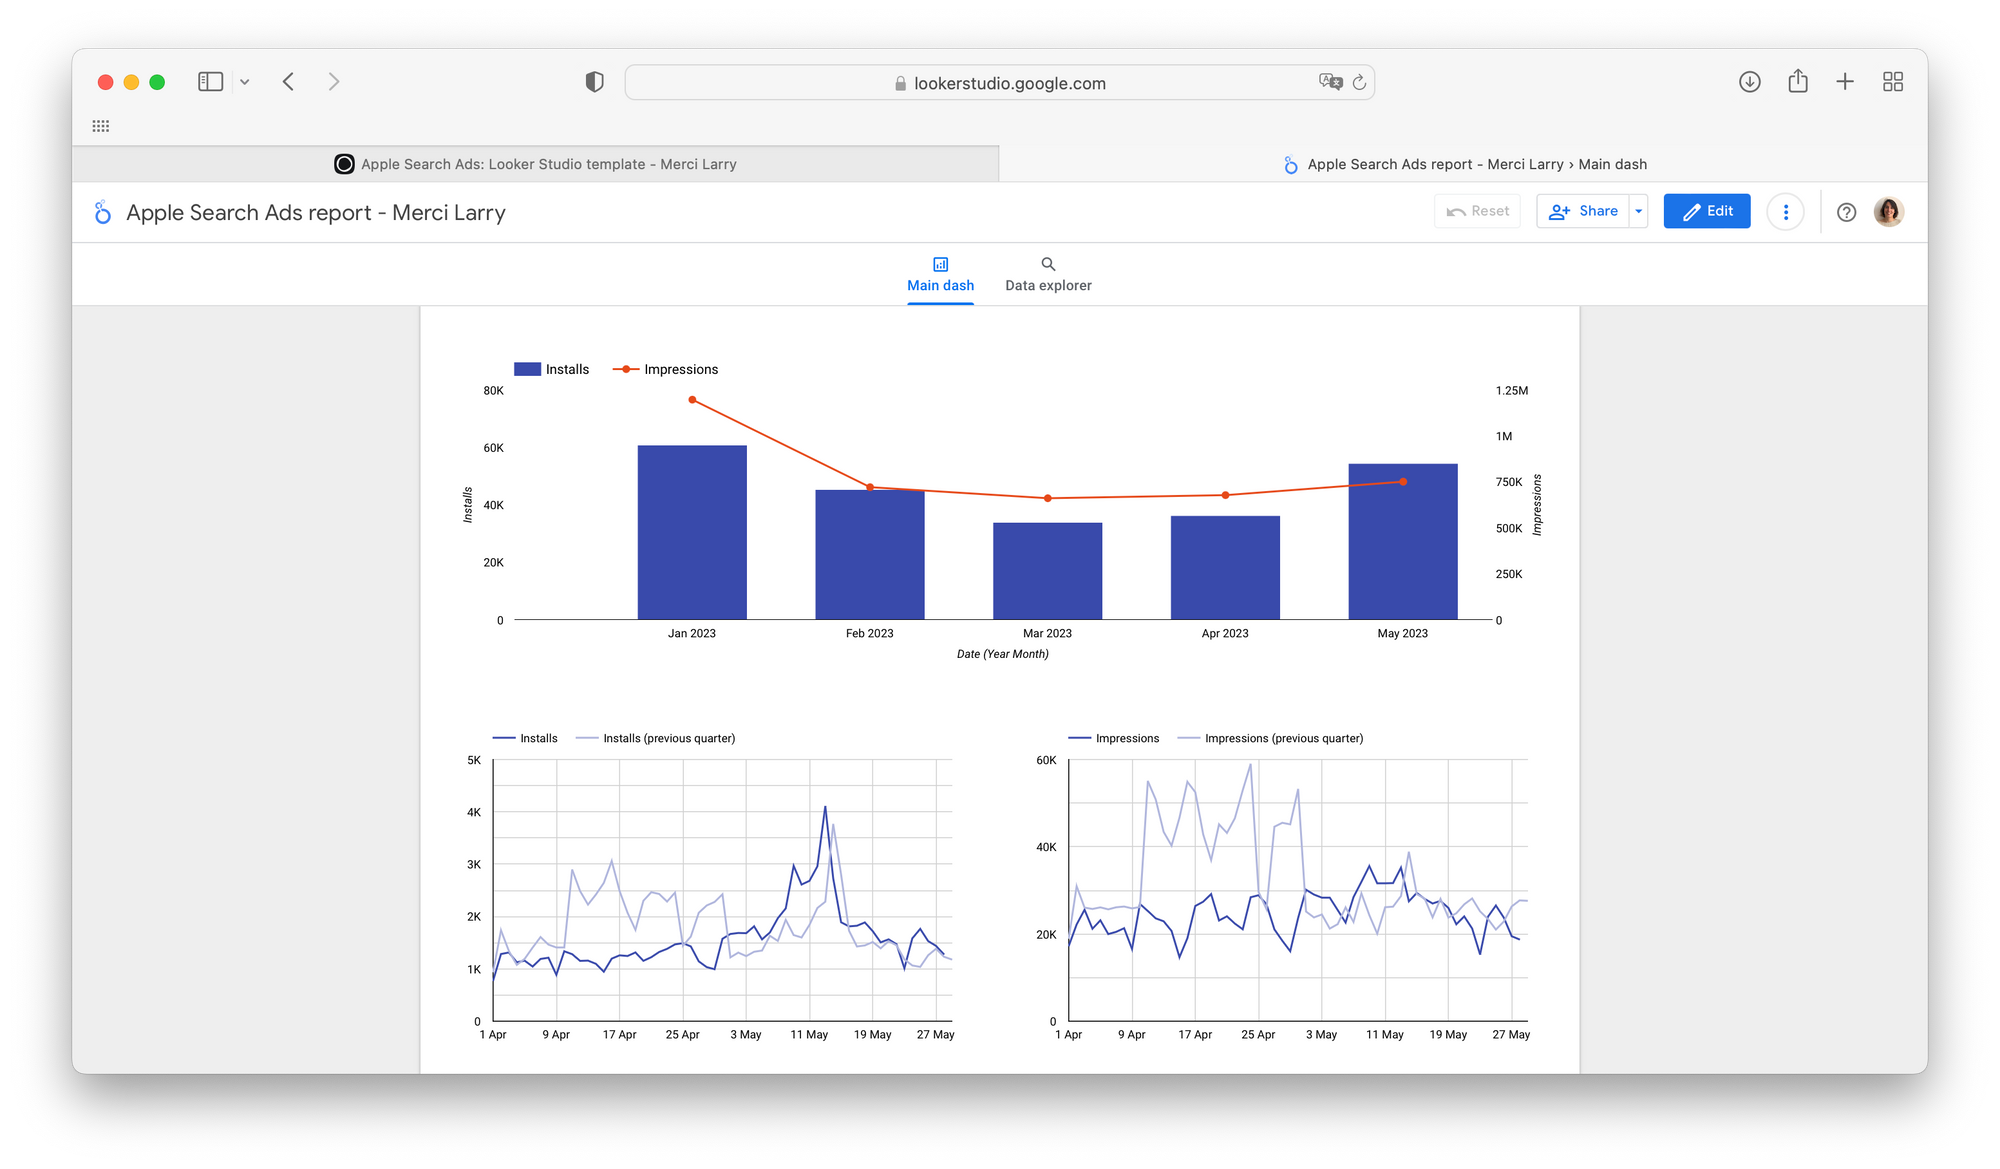
Easily track your total number of installs and your impressions day by day. It can be useful for spotting market trends (higher or lower demand, impact of competition, etc.) as well as seasonal effets.
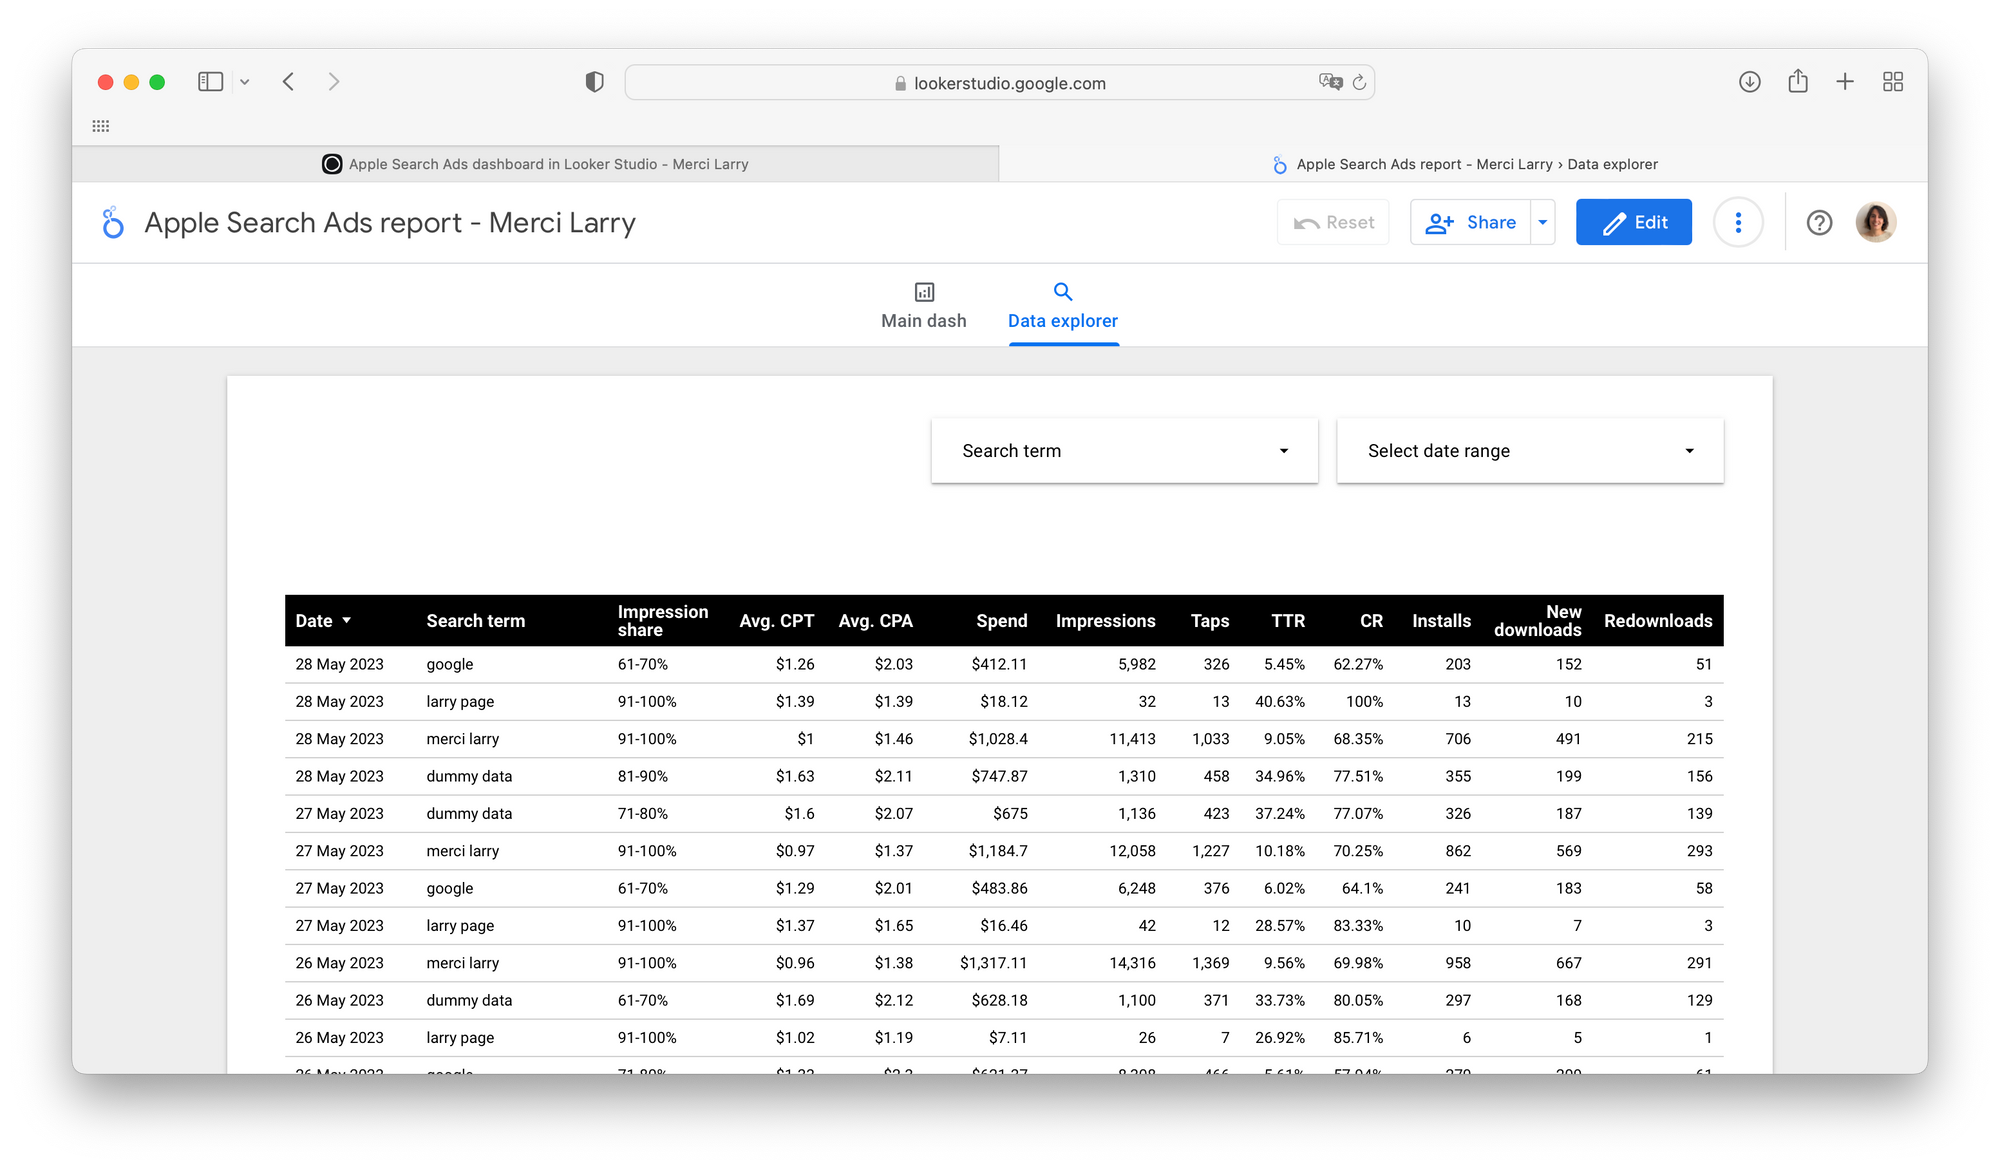
Data explorer
By using this tab, you will get a full overview of all the most important data related to your search terms and including impression share. This is not (yet?) a view we can customize directly in Apple Search Ads so the data explorer tab is really helpful for getting everything you need at a glance.
If you plan to use Google Sheets as a data source, make a copy of the dummy data:

And finally, here's the Looker Studio template (make sure to create a copy):


Comments ()